
With the launch of ChatGPT in late 2022, generative artificial intelligence has quickly become one of the most dominant market narratives as the rapid rise in public interest has sparked a gold rush of innovation, investment, and imagination.
The AI industry is changing almost daily as models advance and new applications are created, more computing power is brought online, and engineers push AI’s capabilities further. Currently, most of the market focus is on the infrastructure build-out required to train the new generation of AI models called large language models (LLMs). In time, the focus will shift more towards the end applications being built with LLMs and which companies are most effectively employing those applications in their operations to drive cost saving efficiencies or new revenue opportunities. Despite an ever-changing landscape, there are still several key economic implications that we believe will persist throughout several market sectors as the AI industry develops.
This report seeks to provide our investment team’s perspectives on the following questions relating to generative AI and its implications for investors:
- Generative AI Overview: How might generative AI advancements impact labor productivity and economic growth potential?
- Regional Impact: How do the productivity & economic growth implications vary by geographic region? What countries are poised to see the largest impact?
- Data Center Boom: What’s the expected scale of the data center capex boom and how sustainable is it? What industries stand to benefit?
- The GPU Revolution: What is underpinning the large shift in capital investment? What are the prospects for leading AI chip designers? Comparison to Prior Booms & Busts: How does this compare to prior hyper-investment cycles like the Dot Com bubble and what can be gleaned from those cycles?
- Power Grid Bottleneck: How will rising AI data center construction impact electricity and energy demand?
While this report discusses our current thinking for investing toward this significant secular trend, we also acknowledge that this technological shift will unfold in ways that no one can fully anticipate, which requires us to continue to adapt and evolve our thinking as the facts evolve. We would also caution that exuberant markets driven by powerful narratives can cause investors to make valuation or duration of earnings power an afterthought as they become engrossed in investing in the theme at any cost. As Warren Buffett once quipped, “speculation is the most dangerous when it looks the easiest.” While our investment team is willing to pay up for wonderful businesses, sustainability of earnings and reasonable valuations will always be at the cornerstone of our philosophy to ensure that we continue to protect and grow client’s wealth responsibly.
Generative AI Overview
 Artificial intelligence has been building and advancing
for many years; Generative AI marks a next step in the evolution of AI in that it is no longer just focused on pattern recognition and prediction as new AI models are now able to generate novel content including text, images, audio, and videos. This
evolution is not just about advancements in the methodology to train large language models (LLMs) like ChatGPT or Alphabet’s Gemini, but it is as much about the significant breakthroughs in computing power that are allowing a much larger amount
of data to be processed and stored to train the models. The growing popularity of ChatGPT at the end of 2022 and start of 2023 brought these developments into the broader public view, which has sparked significant investment.
Artificial intelligence has been building and advancing
for many years; Generative AI marks a next step in the evolution of AI in that it is no longer just focused on pattern recognition and prediction as new AI models are now able to generate novel content including text, images, audio, and videos. This
evolution is not just about advancements in the methodology to train large language models (LLMs) like ChatGPT or Alphabet’s Gemini, but it is as much about the significant breakthroughs in computing power that are allowing a much larger amount
of data to be processed and stored to train the models. The growing popularity of ChatGPT at the end of 2022 and start of 2023 brought these developments into the broader public view, which has sparked significant investment.
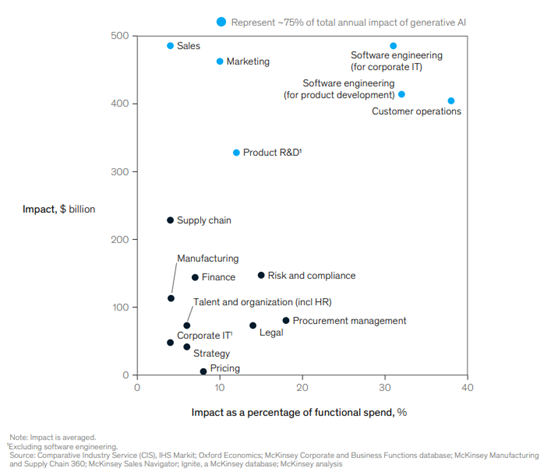
The breakthrough of generative AI has significantly brought forward expectations of the timeline to replicate human performance across a range of technical abilities. Human-level performance in capabilities like creativity and logical reasoning, which were once thought to be unachievable for decades yet to come, now seem within reach now or in the next few years. The time between the Wright Brothers’ first flight and the Moon Landing was 65 years. It’s likely that the current state of generative AI is much closer to the Wright Brothers than the Moon Landing – and it may take much less than 65 years for generative AI to surpass what we originally thought was capable. For now, some have compared the impact of AI to having infinite interns able to take on simple, mundane tasks, freeing up resources for higher value-add work. Today most of the efficiency gains are expected to occur in four job functions:
- Software engineering: Coding assistants greatly improve the efficiency of software development by generating code based on natural language inputs and suggesting or auto-populating lines of code as programmers develop applications.
- Customer Operations: While the prospect of more customer service chat bots likely doesn’t sound all that enticing, AI models are being used to make that experience (slightly) more bearable. It’s now becoming more common to cancel cell phone plans, add HBO to a cable subscription, or re-order a new gadget that was damaged during shipping without having to wait on hold and talk to a customer service agent.
- Sales and Marketing: Generative AI is being used to generate ideas for advertisements, produce considerations for promotional content or newsletters, and develop draft content ideas for emails to customers or prospects.
- Product R&D: Generative AI and improving computing power may greatly expand the product development capabilities, including areas like robotics and drug discovery, as many new product designs and input combinations can be explored, tested, and optimized. In the pharmaceutical industry, the vast majority of medical records and patient data go unused, but several leading drugmakers are trying to change that. For example, Eli Lilly (LLY) recently announced a strategic partnership with Isomorphic Labs, a division of Alphabet (GOOGL) that uses artificial intelligence to enhance drug discovery and development.
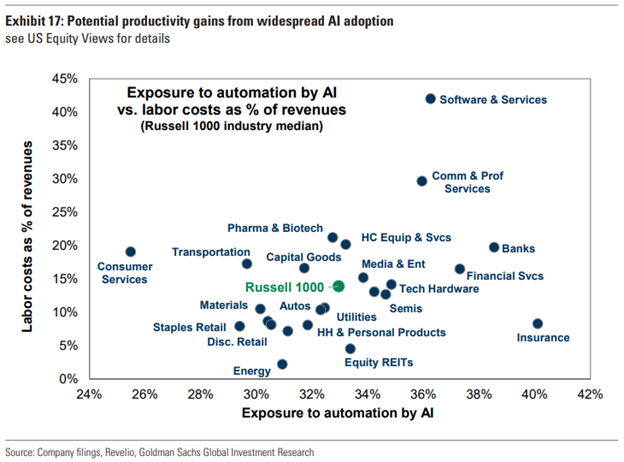
While many business functions may benefit from generative AI, these four functions stand out as having the largest proportion of their costs exposed to AI automation as shown in the below exhibit from McKinsey & Company1. McKinsey’s analysis forecasts that 75% of the efficiency gains and cost savings will come from these 4 functions. Based on the job functions that are most likely to see a productivity boost, we can map out the industries most likely to see the highest impact from productivity gains as reflected below in the chart from Goldman Sachs2.
Forecasted Economic Impact: by Job Function
Industries with high labor intensity and large proportion of that labor bill exposed to those four job functions may see the greatest impact. However, from an investment standpoint those same industries are also the most vulnerable to disruption. The software and IT services industry may serve as a prime example; this industry is already beginning to reap the benefits of greater coding efficiencies to do more with fewer high-paid software engineers. However, these same businesses may also struggle against rising competition amid lower barriers to entry and more enterprise customers opting to do coding work in-house or with lower cost substitutes. There will likely still be notable winners within software and services, but the rising disruption risk warrants greater selectivity.
Potential productivity gains from widespread AI adoption
Regional Impact
While developments from generative AI and the externalities of new innovations (both positive and negative) will be diffused across the globe, the economic impact of AI likely will not be felt evenly across regions. Government policy and regulation, access to skilled labor, financial capacity to afford expensive infrastructure investment, and access to cheap and abundant energy will shape varying results geographically.
AI Economic Impact Index by country
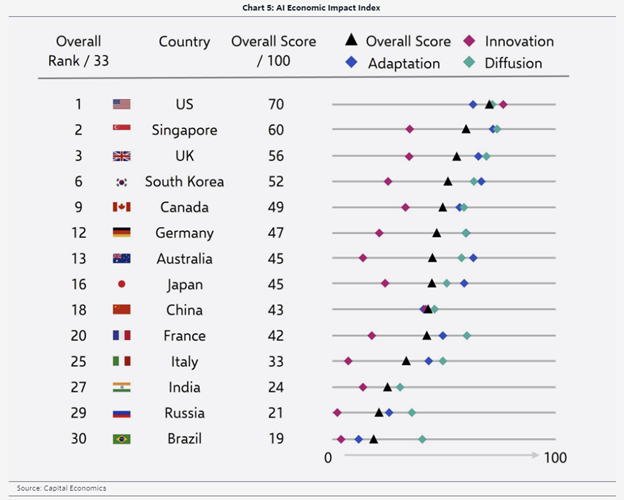
To try to encapsulate the potential economic impact of AI by region, Capital Economics formulated a helpful framework to score countries based upon three pillars: innovation, diffusion, and adaptation3. Innovation measures the dynamism of private industry to develop new technology and applications. Diffusion measures how well policymakers and enterprises facilitate the growth and adoption of new tech. Adaptation measures how well the economy can redeploy displaced workers and capital from areas that are disrupted. The high- level results of Capital Economics’ analysis are summarized in the table above.
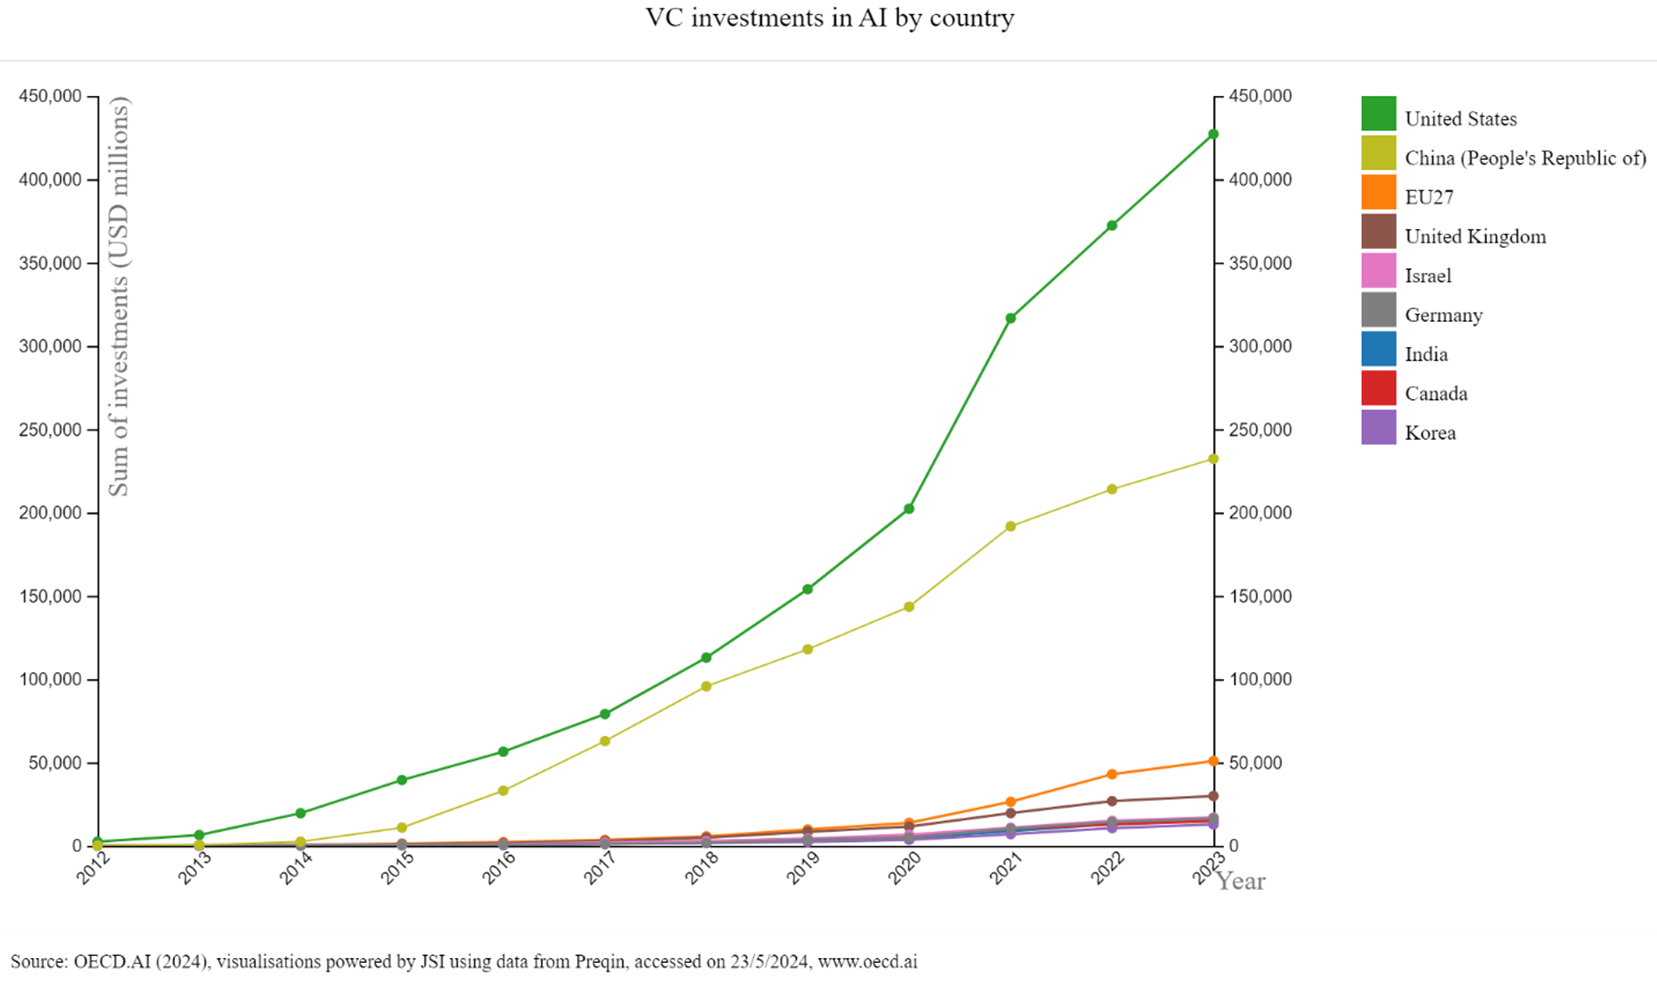
In terms of innovation, the United States and China stand out based on the potential of private industry. The two nations are locked in an arms race for the top industry talent, and both are pouring extensive capital and resources into building data center/semiconductor infrastructure, energy generation, and AI startups. The chart below from the Organization for Economic Co-operation and Development (OECD) demonstrates how the cumulative venture capital investment in AI in the U.S. and China have significantly outstripped the rest of the world4.
VC Investments in AI (Cumulative) by country
However, differences in the role of government may drive material differences in economic impact as supportive policy (like subsidies) and lower government intervention and regulation grease the wheels of innovation and diffusion in the U.S. more than in China. Other nations including Singapore, South Korea, and the U.K. also score highly in Capital Economics’ analysis in terms of diffusion and adaptation, despite lower innovation scores than the U.S. and China.
While higher productivity gains in the U.S. may provide a relatively stronger tailwind to corporate profit growth over the long-term compared to other nations, the faster pace of investment and commercialization is a double- edged sword that also introduces greater risk of overbuilding and financial market bubbles (among other risks like malicious actors) that we explore further in the Comparison to Prior Booms & Busts section. Additionally, other nations stand to benefit from playing different roles in the technology value chain. Japan and the Netherlands, for example, are both home to several leading equipment providers for semiconductor manufacturing benefitting from the surge in global chip factory investment. Additionally, Taiwan remains a powerhouse in manufacturing the most advanced logic semiconductors used for AI and high performance computing, despite the ongoing global efforts to diversify this concentration for geopolitical reasons. Another factor supporting leading innovation in the U.S. is its existing and developing data center infrastructure, much of which has been driven by deep-pocketed mega-cap tech companies. The U.S. represents 34% of the global data center market when measured by units (the next largest country is Germany at 6%), and 40% of global power consumption by data centers, according to research from J.P. Morgan5. An important caveat is that only a small percentage of those existing data centers would be deemed “AI ready” as traditional data centers were primarily built using server CPUs (Central Processing Units) that are much less efficient for training and applying LLMs than GPUs (Graphic Processing Units). Going forward, investment is shifting heavily to AI data centers comprised of GPUs, and the U.S. development pipeline appears to maintain its global lead here as well with support from big tech.
Data Center Boom
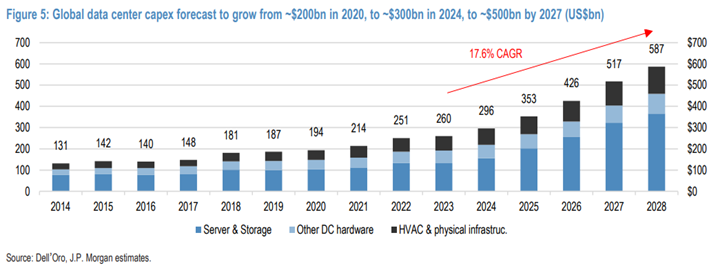
One of the most important market implications of the emergence of generative AI is a material inflection in infrastructure investment geared towards building and supporting AI data centers that kicked off in earnest last year and appears to be in early innings. Data center investment is not necessarily a new theme as global capital expenditures (capex) on traditional data centers grew at a robust clip of 8-9% per year in the decade leading up to 2023; however, the demand for larger, more power-hungry and computationally-intensive AI data centers is expected to kick capex into a new gear, with J.P. Morgan analysts forecasting a 17.6% compound annual growth rate over the next 5 years5.
While forecasts on the magnitude and duration of data center capex vary widely, we do anticipate a material acceleration that will take years to play out. That expectation is supported in part by who is footing the bill; seven mega-cap tech companies alone (Alphabet, Amazon, Apple, Meta, Microsoft, IBM, and Oracle) invested $119 billion in data center capex in 2023, accounting for 45% of the global total, and most of those companies have guided to rising levels of data center investment in the year ahead. These companies in general are sitting on pristine balance sheets with minimal debt, generate massive amounts of cash, and are highly motivated to win in AI even with high uncertainty as to the timing and extent of future resulting sales and profits. However, that does not mean that investment will evolve in a smooth upward trajectory as it may instead move in fits and spurts that add volatility into markets.
As a result of the surge in data center capex, many of the current market beneficiaries that are recording material impacts on earnings are the “AI enablers” providing the picks and shovels in the data center gold rush. This group includes a host of semiconductor companies that are capturing a lot of the headlines, as we discuss in the next section, but it also includes some less well-known beneficiaries including industrial companies providing electrical equipment for power generation, HVAC, and utility base stations as well as other hardware/electronic component suppliers. For example, Amphenol (APH) is an electronic component supplier benefiting from rising data center demand for its interconnect solutions for high-speed data transmission and connectivity between servers.
Global data center capex forecast to grow from -$200bn in 2020, to -$300bn in 2024, to -$500bn by 2027 (US$bn)
The GPU Revolution
Undergirding the inflection in data center investment is a significant shift in computing architecture as new data centers move to GPU servers compared to traditional data centers comprised of CPU servers. Given a significant supply/demand imbalance with soaring demand outstripping insufficient (albeit growing) supply, today’s top of the line GPUs can cost 20 times or more the cost of high-end CPUs.
And yet despite the extraordinary mark-up, the economics of GPU servers still make far more sense for training LLMs than trying to use lower-cost CPUs. This is because GPUs can handle many similar tasks at once, process data faster, have more memory bandwidth, and are more energy-efficient for supporting the highly computation- intensive process of training an LLM. According to Nvidia CEO Jensen Huang, a $10 million investment would construct 960 CPU servers that could train 1 LLM; the same $10 million investment in GPUs would only build 48 GPU servers but would be able to train 44 LLMs with less than a third of the energy consumption.
| Greater Flexibility/Adaptability Slower Speed/Less Precision | AI Accelerator Chips | Greater Speed/Less Precision Limited Flexibility/Adaptability |
|---|---|---|
CPUs - "Generalist"
| GPUs - "Specialist"
| ASICs/Custom Accelerators - "Industrial robot"
|
Due to the sea shift toward GPUs, Nvidia, the leading designer of server GPUs with almost 90% market share, has become the poster child for artificial intelligence, and rightfully so in many respects due to foresight of management and the company’s unmatched innovation in GPUs. The company has capitalized on its unique position to drive incredible returns and earnings growth as it extracts a large proportion of the initial economic value creation from the GPU gold rush. Additionally, NVDA’s rapid pace of innovation and its ecosystem of software and hardware around the GPUs will likely reinforce a leading market position well into the future (albeit likely not 90% as rivals close the gap).
While Nvidia has carved out its place at the forefront of a significant secular trend, its enviable position is now well acknowledged by the stock market with a market cap of roughly $3 trillion, and its incredible growth and profit margins may be difficult to sustain longer-term as supply and demand gradually find a more natural balance and GPU prices normalize. As of the time of this writing, NVDA’s market capitalization now accounts for almost 40% of the market cap of FactSet’s World Semiconductor Industry index that seeks to represent the majority of all global publicly traded chip companies across the semiconductor value chain (the index is comprised of 536 companies). That compares to NVDA’s proportion of global revenue that is expected to reach 8% over the next 12 months and its operating earnings that is expected to account for a staggering 29%, based on our analysis of consensus analyst estimates from FactSet. The much larger share of earnings compared to sales speaks to how extraordinary Nvidia’s profit margins are currently relative to the industry.
Those numbers are especially notable in light of the company’s concentrated customer and supplier relationships. A large proportion of sales in recent quarters have come from big tech companies like Amazon, Alphabet, Meta, and Microsoft and each has plans to develop its own in-house chips to reduce dependence on Nvidia. On the supplier-side, Nvidia outsources the manufacturing of its chips with a high degree of dependence on Taiwan Semiconductor Manufacturing Company, the world’s leading manufacturer of advanced logic chips.
% of Global Semiconductor Market Capitalization
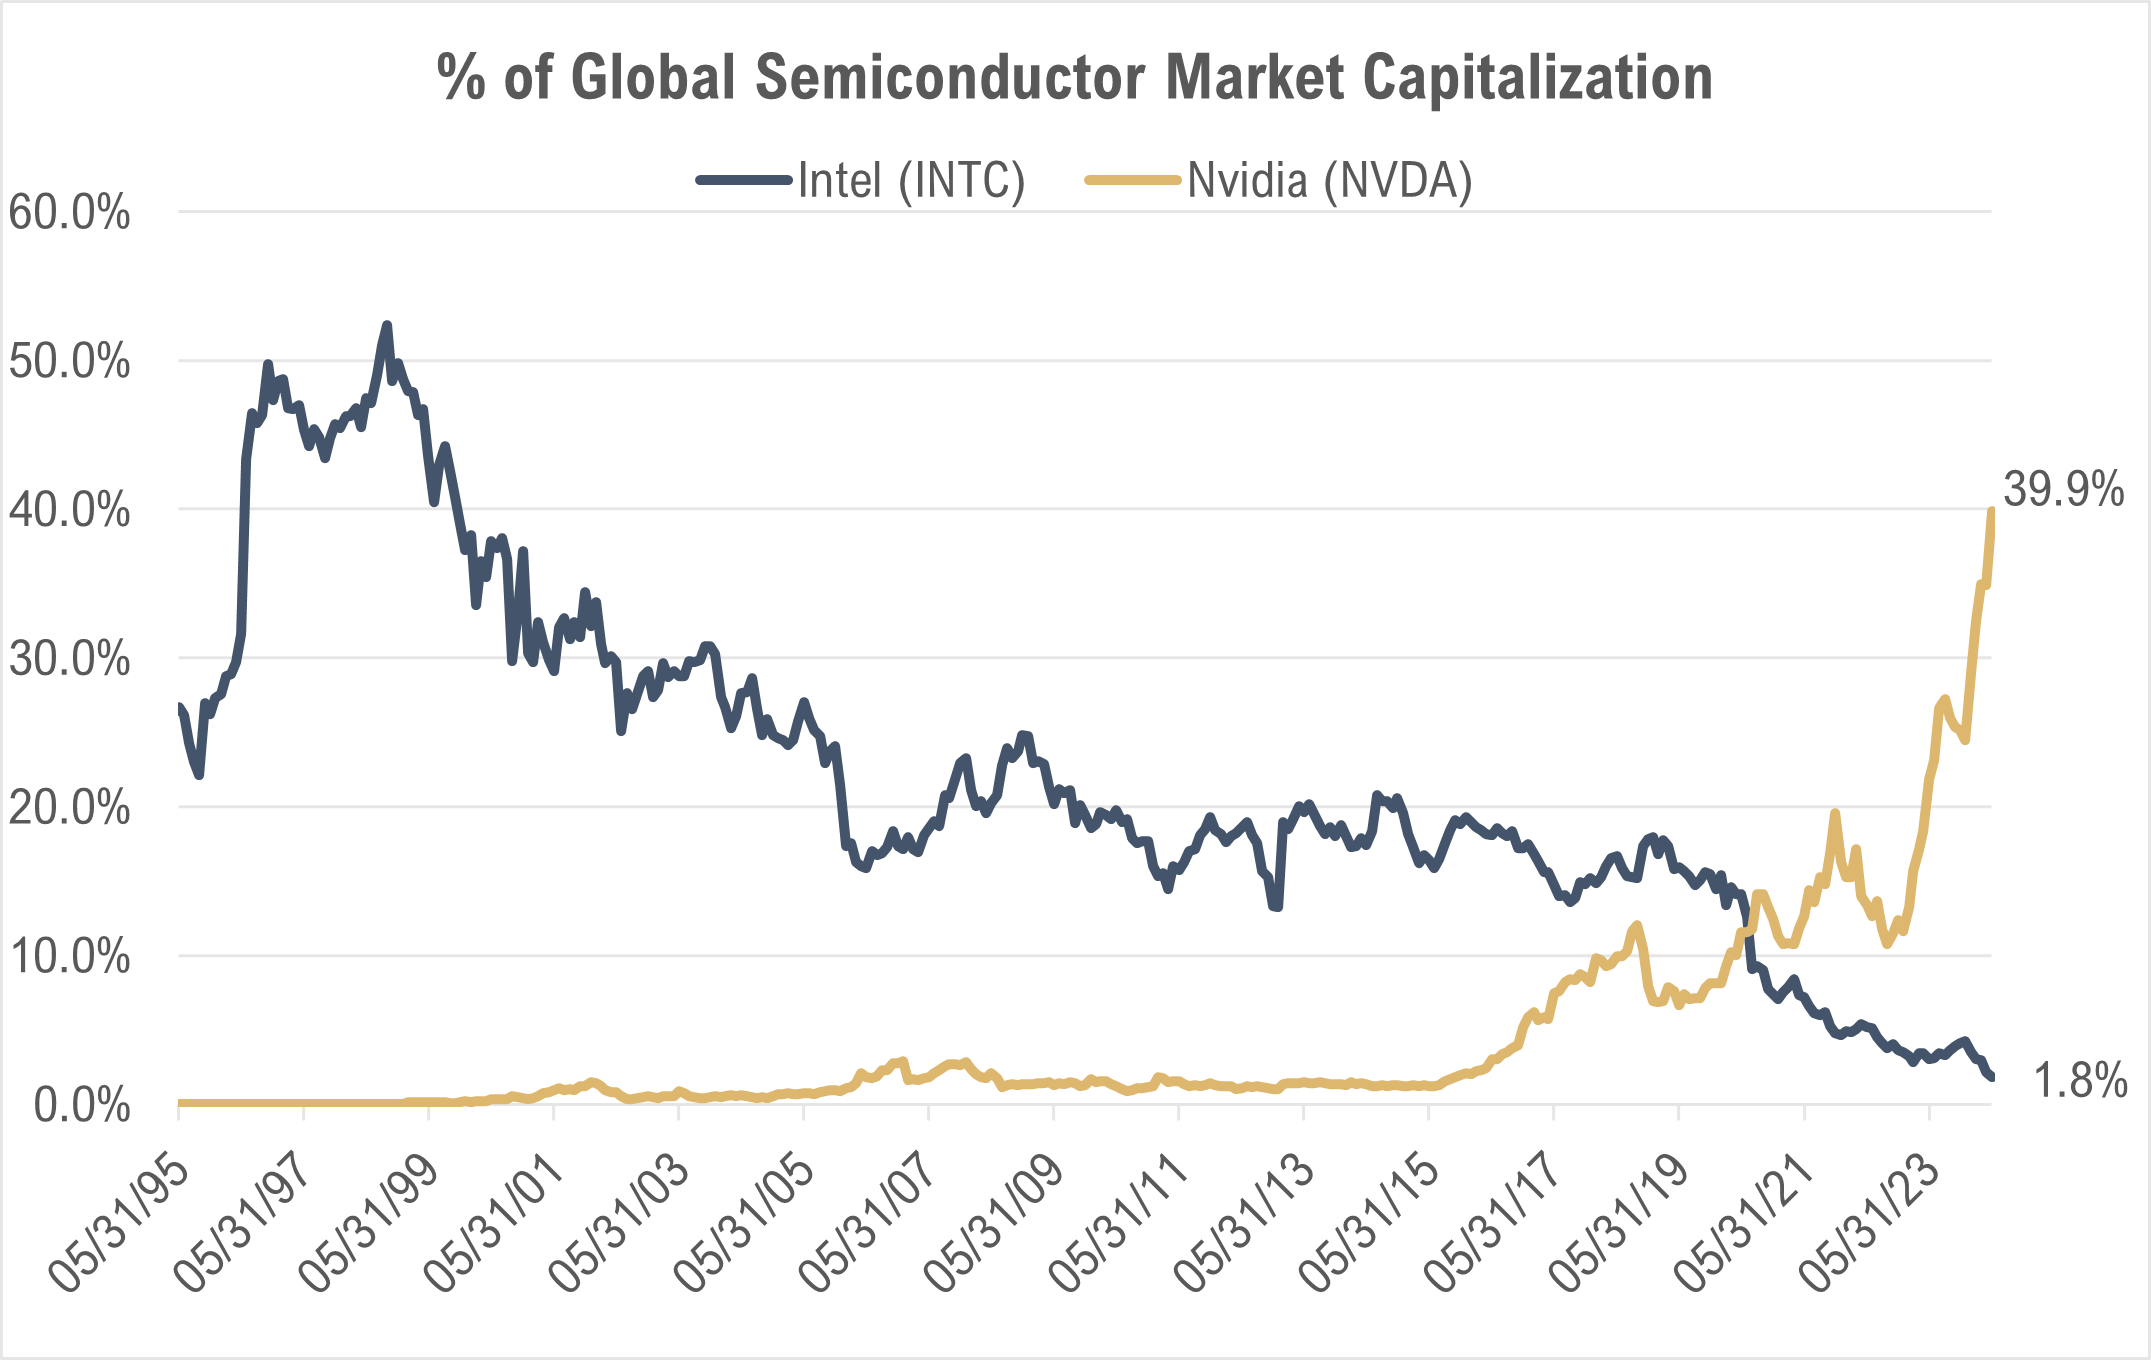
Looking at historical analogs, Nvidia’s growing weight of the global semiconductor value chain is not unprecedented. Intel also soared to incredible highs as it led the last computing revolution during the tech bubble in the late 1990s, but it has seen its market share gradually eroded over the last two decades.
 Over time as the focus shifts from training LLMs to the development and deployment of applications built on top of the models (also known as inference), we believe that a growing proportion of capital investment will shift
toward developing custom AI chips (sometimes known as Application Specific Integrated Circuits or ASICs). As the name implies, ASICs are tailored to a specific use-case and can provide even greater performance and cost efficiency than GPUs for large
workloads, though they are difficult to reprogram and thus less suited to the training and exploration phase. The trend toward greater customization would benefit chip designers like Broadcom (AVGO) who has been partnering for years with several of
the tech giants (like Google, Microsoft, and Meta) on developing their own custom AI chips. It would also be a tailwind to providers of EDA software (Electronic Design Automation), which is a crucial tool in designing, testing, and optimizing semiconductors
and how they fit together in electronic systems.
Over time as the focus shifts from training LLMs to the development and deployment of applications built on top of the models (also known as inference), we believe that a growing proportion of capital investment will shift
toward developing custom AI chips (sometimes known as Application Specific Integrated Circuits or ASICs). As the name implies, ASICs are tailored to a specific use-case and can provide even greater performance and cost efficiency than GPUs for large
workloads, though they are difficult to reprogram and thus less suited to the training and exploration phase. The trend toward greater customization would benefit chip designers like Broadcom (AVGO) who has been partnering for years with several of
the tech giants (like Google, Microsoft, and Meta) on developing their own custom AI chips. It would also be a tailwind to providers of EDA software (Electronic Design Automation), which is a crucial tool in designing, testing, and optimizing semiconductors
and how they fit together in electronic systems.
Prior Booms & Busts
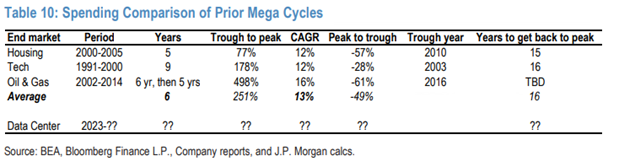
Such significant capital investment and exuberant stock market valuations are reminiscent of past hyper-investment cycles. Looking back at the major cycles of the past several decades, including the housing, tech, and oil & gas booms, analysts at J.P. Morgan noted that these cycles have typically played out over multiple years (6 years on average) with real capital investment growing annually in the low- to mid-teens5. These cycles laid the groundwork for structural economic changes with notable long- term benefits; however, each of these investment cycles helped fuel unsustainable financial asset bubbles and ultimately ended in substantial overcapacity well beyond short-term productive use. As a result, new investment eventually crashed and took well over a decade to recover to prior peaks as shown in the table below.
Spending Comparison of Prior Mega Cycles
This pattern is reflective of a quote from Bill Gates that “we always overestimate the change that will occur in the next two years and underestimate the change that will occur in the next ten.” For example, during the tech/telecom bubble of the late 1990s and early 2000s, approximately 90 million miles of fiber optic cables were laid by companies like Global Crossing and WorldCom, according to entrepreneur Daniel Gross in the CNN article “Bubbles that Built America”6. This massive infrastructure investment was driven by the anticipation of exponential growth in internet usage and data demand. However, the actual demand did not match the optimistic projections initially, leading to a significant oversupply of fiber capacity. It is estimated that as much as 95% of the installed fiber remained "dark" or unused following the burst of the bubble in 2001. While many overleveraged companies were washed out in the reckoning of the bubble burst, eventually the massive network infrastructure brought affordable broadband access to millions of American households, and it formed the foundation for a generation of new internet companies like Google, YouTube, and Facebook that were able to successfully leverage the reliable and cheap infrastructure to rapidly scale their businesses.
While elements of the story today rhyme with that of the tech bubble, there are some distinct differences as well. Perhaps the most important difference that we alluded to previously is in the source of the investment as a large proportion of spending during the tech bubble was fueled by debt-laden telecom companies who eventually went belly up as they ran out of capital and couldn’t service rising financing costs. Today, a large proportion of generative AI spending is coming from deep-pocketed tech giants that generate enough cash flow to more than offset losing billions per year on strategic projects where they believe in the long-term payoff (consider Alphabet’s moonshots like autonomous vehicles or Meta Platform’s virtual reality investments). Additionally, while U.S. tech stock valuations today are at elevated levels relative to historical averages, they remain well below the peak levels of the Dot Com bubble (at least as of the time of this writing).
Power Grid Bottleneck
One of the biggest roadblocks to U.S. ambitions for AI leadership likely comes in the form of energy and electricity constraints as the list of proposed data center projects is growing faster than the electricity infrastructure needed to power it. Rising demand on the U.S. power grid comes not only from data centers but also from other major secular drivers such as electrification, decarbonization, and the onshoring of manufacturing.
AI data centers demand 10 to 50 times more power than traditional data centers due to their intensive computational needs. These data centers alone are expected to add 323 terrawatt hours of electricity demand in the U.S. by 2030, which is roughly seven times greater than the annual power consumption of all of New York City, according to an analysis by Wells Fargo7. As a result, data centers, which currently consume about 3-4% of US power, are projected to rise to consuming anywhere from high single digits to as high as 20% of US power by the end of the decade8. Additionally, AI chips generate seven times more heat than traditional chips, increasing the demand for HVAC systems to keep servers from overheating.
This escalation in power demand is challenging utilities, which have seen flat power consumption over the past decade. The approval process for new energy generation projects is lengthy, further complicating the situation. U.S. utility providers are suggesting wait times of 2-3 years or more in many instances to deliver the electricity needed to power some new data center projects9,10.
 Meanwhile, mega-cap tech companies' power needs are
conflicting with their ambitious sustainability goals, as several U.S. tech giants are aiming for net-zero carbon emissions by 2030. Although renewable energy supply is growing, it may not be enough to satisfy incremental power demand, thereby delaying
projects or requiring more fossil fuel consumption to fill the gap with natural gas seen as a likely source7. Additionally, reliability issues with solar and wind power necessitate advancements in energy storage. Nuclear power is also an area seeing
a lot more interest as a clean, reliable source of energy. Amazon AWS recently purchased a nuclear-powered data center in Pennsylvania with the potential to eventually sell electricity surpluses beyond data center needs back to the power grid. However,
the U.S. has fallen far behind in nuclear development capabilities due to safety concerns and public opposition.
Meanwhile, mega-cap tech companies' power needs are
conflicting with their ambitious sustainability goals, as several U.S. tech giants are aiming for net-zero carbon emissions by 2030. Although renewable energy supply is growing, it may not be enough to satisfy incremental power demand, thereby delaying
projects or requiring more fossil fuel consumption to fill the gap with natural gas seen as a likely source7. Additionally, reliability issues with solar and wind power necessitate advancements in energy storage. Nuclear power is also an area seeing
a lot more interest as a clean, reliable source of energy. Amazon AWS recently purchased a nuclear-powered data center in Pennsylvania with the potential to eventually sell electricity surpluses beyond data center needs back to the power grid. However,
the U.S. has fallen far behind in nuclear development capabilities due to safety concerns and public opposition.
While utility companies are likely to benefit from rising power demand (though this is geographically dependent), they also face regulated profits and investment approval constraints, which limit their upside despite increased load growth. Additionally, higher inflation and interest rates pose headwinds to this highly capital-intensive industry, which warrants selectivity. Companies levered to rising clean energy demand may present interesting exceptions.
Although new energy production is part of the solution, advances in electricity consumption efficiency, potentially driven by AI, will play a critical role as well. For example, the CEO of Saudi Aramco, Amin Nasser, pointed out that over the last 15 years improved energy efficiency has reduced global oil demand by 90 million barrels/day compared to wind/solar investments substituting about 15 million barrels/day. This may benefit electrical component companies that produce power generation and storage equipment and energy efficiency technologies.
Source Citations:
1. “The economic potential of generative AI.” McKinsey & Company, June 2023.
2. “The (AI) trade after the trade: Identifying potential long-term EPS beneficiaries of AI adoption.” Goldman & Sachs, 8/21/2023
3.
“AI, Economies and Markets – How artificial intelligence will transform the global economy.” Capital Economics, www.capitaleconomics.com/ai-economies-and-markets-how-artificial-intelligence-will-transform-global-economy
4. OECD.AI
(2024), visualizations powered by JSI using data from Preqin, accessed on 28/3/2024, www.oecd.ai
5. “Data Center Deep Dive: The Most Ferocious Investment Inflection in Decades.” J.P. Morgan, 4/11/2024
6. Gross, D. (2007, May
16). “Bubbles that Built America.” CNN Money.
7. Kimball, S. (2024, May 5) “AI could drive a natural gas boom as power companies face surging electricity demand.” CNBC.
8. “How will the GenAI Revolution be Powered?.”
Morgan Stanley – Thoughts on the Market Podcast. April 2024.
9. “Global Data Center Market Comparison.” Cushman & Wakefield, 2024
10. “The Era of Flat Power Demand is Over.” Grid Strategies. December 2023